


Tracking Texas Housing Trends
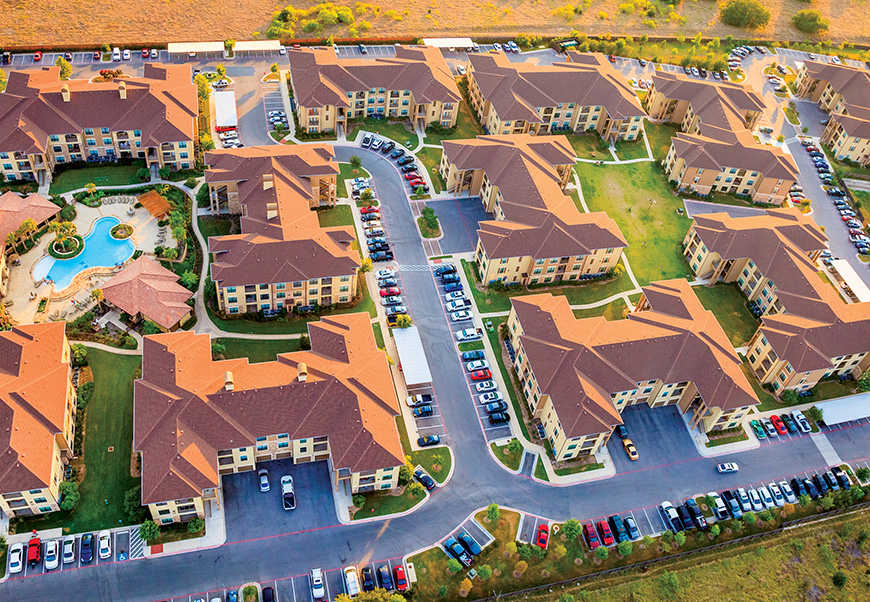

Latest U.S. Census Bureau housing data show Texas’ housing supply increased along with demand from 2005 to 2017. Detached homes are the most favored type of homes, followed by manufactured homes. Buildings with 20 to 49 units are the fastest growing segment of the state’s housing stock. |
The housing sector’s social and economic function is to meet the demand for various types of housing units at affordable prices. Households and individuals in the United States and other advanced countries have the options to own or rent residential units and select the structure, type, size, and locations of their homes based on their preferences and incomes.
The current stocks of residential units in Texas and the U.S. comprise various types of homes, such as detached, attached, and multifamily. They are built in response to economic and demographic factors, preferences, and technology as well as to federal and local government policies intended to provide affordable housing. Over time, the volume and composition of state and national housing inventories change due to changes in these factors.
The Real Estate Center compared long-term trends in the supply and demand sides of Texas housing markets with those of the nation’s and found:
- Texas’ housing supply has increased with growing demand, which has been driven by population and income growth;
- detached homes are the most favored type of homes in Texas, accounting for more than two-thirds of the state’s housing units, followed by mobile (manufactured) homes and buildings with ten to 19 units;
- buildings with 20 to 49 units are currently the fastest growing segment of the state’s housing stock; and
- Texas’ housing occupancy rates, which show which market segments need more or less investment, varied from as high as 90.3 percent for detached homes to as low as 79.1 percent for manufactured homes in 2017.
Texas Housing Stock
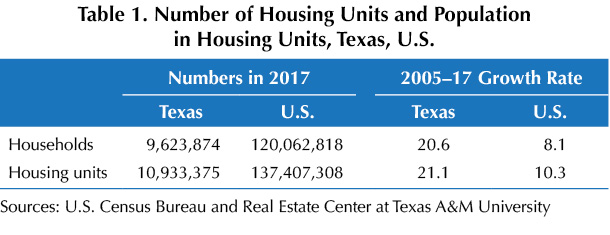
Texas had 9.6 million households in 2017, about 20.6 percent more than in 2005 (Table 1). The U.S. had 8.1 percent household growth during the same period. To accommodate growing demand for housing driven by population and income growth, the state increased the supply of housing units by 21.1 percent to 10.9 million units between 2005 and 2017. Nationally, the number of units increased 10.3 percent.
The U.S. Census Bureau classifies housing into ten groups according to the structure and number of units. Panels A and B of Table 2 show the numbers and market shares of different types of homes on the supply and demand sides of Texas and U.S. housing markets in 2017 as well as their growth rates from 2005 to 2017, the latest year for which data are available.
Detached single-family homes are the most favored types of homes in both Texas and the U.S. The state had more than seven million detached homes in 2017, accounting for 65 percent of the state’s housing stock compared with 61.8 percent for the U.S. (Table 2, panel A). Since 2005, the number of detached homes in Texas has increased by 21.9 percent compared with 11.3 percent for the U.S. In both Texas and the U.S., the market shares of detached homes rose in the Great Recession (GR) and stabilized around 65 and 61.8 percent, respectively. Since recovering from the GR, Texas has maintained a higher average market share than the U.S. (Figure 1).


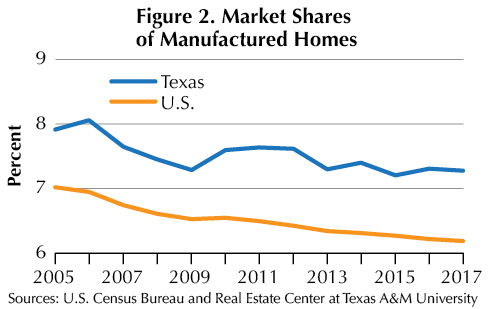
With more than 795,000 units in 2017, manufactured homes make up the second largest segment of Texas’ housing market after detached homes. Manufactured homes accounted for 7.3 percent of total housing units compared with 6.2 percent in the U.S. (Table 2, panel A). Since 2005, the number of manufactured homes in Texas has increased by 11.3 percent compared with a 2.7 percent decline for the U.S. In both the state and the nation, the market share of manufactured homes has trended downward since the recovery from the GR (Figure 2).
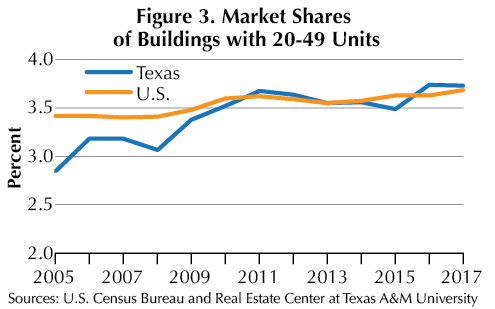
Housing structures of 20 to 49 units constitute the fastest growing segment of Texas’ permanent-structure housing market. Since 2005, this segment has grown by 58.4 percent compared with 18.9 percent in the U.S. (Table 2, panel A). The market shares of these buildings have trended upward at both the state and national levels since 2008 (Figure 3).
Buildings with 50 units or more are the second fastest growing segment of Texas’ permanent-structure housing market. Since 2005, the number of housing structures with 50 or more units has grown by 40 percent compared with 31.4 percent in the U.S. (Table 2, panel A). In both the state and the nation, the market shares of buildings with 50 or more units fell in the GR followed by upward trends since 2010 (Figure 4).

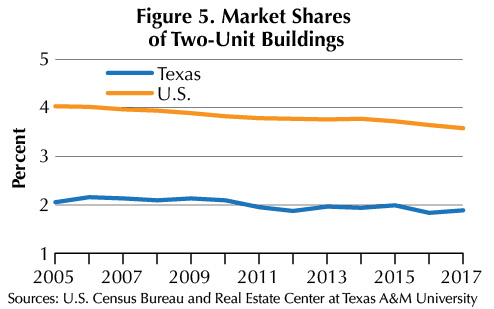
Two-unit structures had the smallest share of the state’s permanent-structure housing market in 2017, accounting for 1.9 percent of the housing inventory. This compared with 3.6 percent for the U.S. (Table 2, panel A). The market shares of two-unit buildings are slowly trending downward at both the state and national levels (Figure 5).
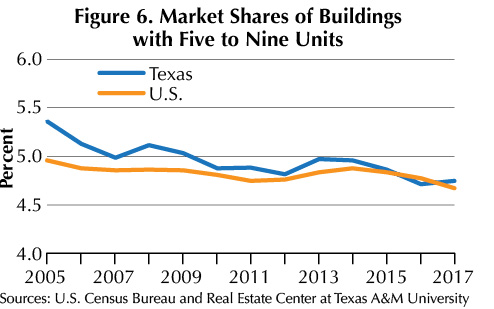
With a growth rate of 7.3 percent from 2005 to 2017, buildings with five to nine units had the smallest growth rate in Texas (Table 2, panel A). The market shares of those buildings have trended downward since 2005 (Figure 6). The 2005–17 U.S. growth rate for that category was 4 percent.
The third largest category of Texas’ housing market in 2017 was buildings with ten to 19 units, which accounted for 6.3 percent of the market compared with 4.4 percent for the U.S. (Table 2, panel A). From 2005 to 2017, buildings in this category increased 15.6 percent in Texas and 8.4 percent in the U.S., but their market shares have not changed significantly since 2005.
Attached homes made up 2.6 percent of Texas’ housing inventory in 2017 compared with 5.9 percent for the U.S. (Table 2, panel A). Since 2005, their volume has increased by 18.1 percent in Texas and 14.1 percent nationally. The market shares of attached homes in both the state and the nation have remained around their 2005 shares.
Buildings with three or four units made up 3.2 percent of Texas’ and 4.4 percent of the nation’s markets in 2017 (Table 2, panel A). From 2005 to 2017, this category increased 13.3 percent in Texas, higher than the nation’s 4.7 percent. However, market shares for neither have changed significantly since 2005.
The number of boats, RVs, vans, etc. used as homes in Texas grew 66.7 percent from 2005 to 2017, but their market shares in 2017 were small—0.2 percent in Texas and 0.1 percent in the U.S. (Table 2, panel A).
Supplies of Texas detached, attached, buildings with 50 units or more, and manufactured homes grew faster than demand for these home types from 2005 to 2017, whereas the demand for buildings with two to 49 units grew faster than supplies for these home structures (Table 2, panels A and B). These changes are reflected in the occupancy rates of these housing segments.
Texas Occupancy Rates
Identifying trends in housing occupancy rates can help market participants identify directions of market conditions and make better-informed forecasts about the demand and supply conditions when planning production and sales of housing units.
Texas’ occupancy rates for all types of homes trended upward after the recovery from the GR but have trended downward in recent years. The rise and fall of occupancy rates were mainly due to responses of the demand and supply sides of the housing markets to changes in population, income, and preferences.
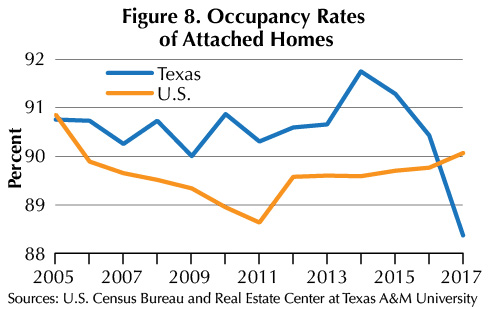
Occupancy for detached homes rose to 91 percent in 2014 in the aftermath of the recovery from the GR, then fell to 90.3 percent in 2017 (Table 3 and Figure 7). Occupancy of attached homes trended upward until 2014, reaching 91.8 percent, before falling to 88.4 percent in 2017, the highest rate after detached homes (Table 3 and Figure 8).
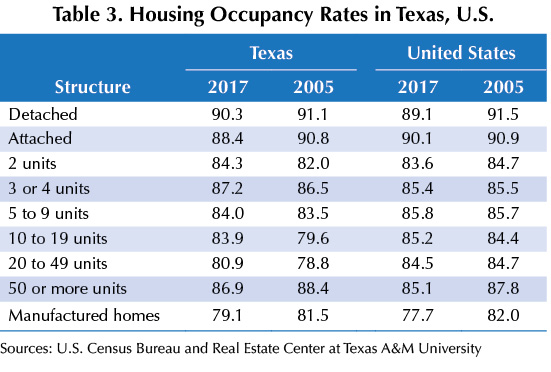

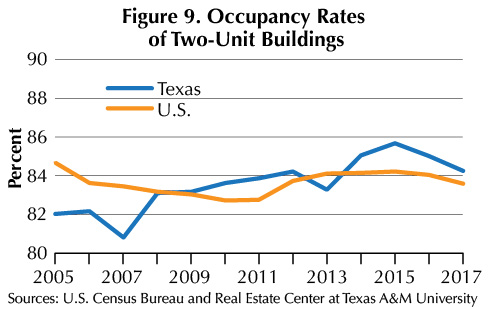
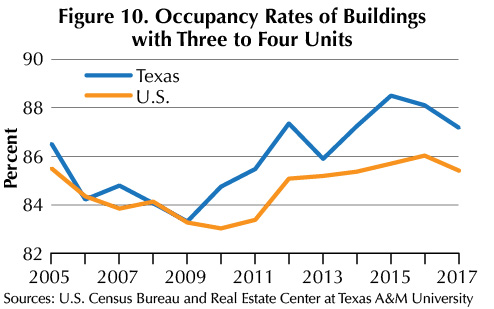
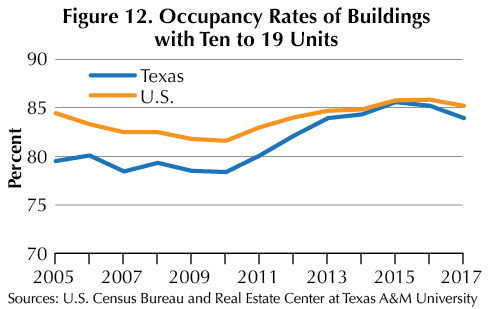
Occupancy rates for two-unit buildings increased from 80.8 percent in 2007 to 85.7 in 2015 then fell to 84.3 percent in 2017 (Table 3 and Figure 9). Buildings with three to four units peaked at 88.5 percent occupancy in 2015 then trended downward to 87.2 percent in 2017 (Table 3 and Figure 10). Occupancy for buildings with five to nine units increased from 80.5 percent in 2010 to 86.9 percent in 2016, but decreased to 84 percent in 2017 (Table 3 and Figure 11). Buildings with ten to 19 units had upward trends in occupancy following the recovery from the GR, reaching 85.6 percent before falling to 83.9 in 2017 (Table 3 and Figure 12).

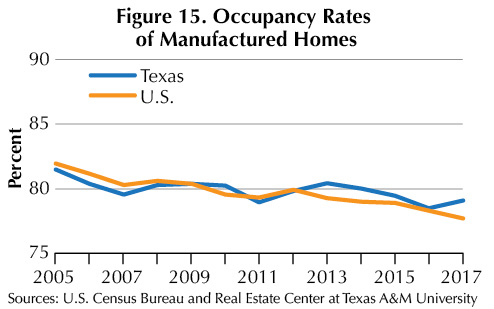
Buildings with 20 to 49 units trended upward until 2015, reaching 84.6 percent occupancy, then fell to 80.9 percent in 2017 (Table 3 and Figure 13). Buildings with 50 units or more have occupancy rates higher than national averages, but the rates have trended downward since 2015, falling to 86.9 percent in 2017 (Table 3 and Figure 14). Manufactured homes have trended downward since 2013, falling to 79.1 percent in 2017 (Table 3 and Figure 15).


____________________
Dr. Anari ([email protected]) is a research economist with the Real Estate Center at Texas A&M University.
You might also like

TG Magazine
Check out the latest issue of our flagship publication.